A 2020 study found that the UK’s love of bread has declined in the past 50 years, as people have switched to rice, pasta and noodles. Despite this, the average Briton still gets around 12% of their daily energy from bread.
The healthiness of a bread is dictated by the flour that’s used to produce it. While baking methods and different oven temperatures do affect the nutrient content of bread, their impact is far less than that of the flour itself.
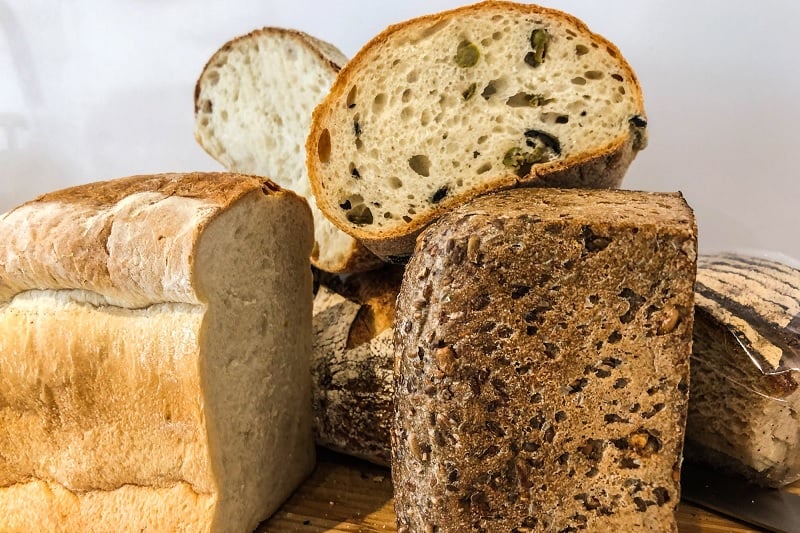
Flour Type: The Key to Nutritious Bread
All breads are made with flour, which typically comes from starchy grains like wheat, barley, buckwheat, oats, rye and corn.
These small grains have a tough, hard exterior (known as bran) and a softer, whiter-coloured interior called the endosperm.
The bran contains most of the grain’s nutrients and vitamins. It’s especially high in B vitamins.
The endosperm contains starch (a form of carbohydrate) and some protein. Once eaten, this starch is converted into energy within the body and the nutrients are absorbed through our stomach and intestines.
Different types of bread are made using flours containing different proportions of grain bran, endosperm and germ.
What Is ‘Healthy’ Bread?
To accurately rate how ‘healthy’ different types of bread are, we’ve compared the glycaemic index, glycaemic load and dietary fibre content of eight different bread types.
The nutrient content (vitamins and minerals) varies greatly between brands and products. For this reason, we haven’t used nutrient content when calculating bread healthiness.
To help keep the UK healthy, British bakers are required by law to ensure that their bread contains a certain amount of nutrients per 100g of flour used. This is known as fortification.
This regulation came into place in the Bread and Flour Regulations of 1998 and ensures that the nation’s loaves contain nutritious amounts of four vitamins and minerals: calcium, iron, thiamine and niacin.
Dietary fibre
Dietary fibre is sometimes known as ‘roughage’, ‘bulk’ or more simply as ‘fibre’. According to the NHS, British adults should be including 30g of dietary fibre in their diet each day. However, most people fall short of this target; the average daily fibre consumption in the UK is only 18g.
Once consumed, fibre doesn’t get turned into energy. Instead, it passes through the digestive system, helping to keep it healthy and regular. Dietary fibre also increases feelings of fullness.
Glycaemic index
Glycaemic index is a measurement of how quickly a food impacts a person’s blood sugar levels.
Fruits and vegetables have a low glycaemic index while sugary foods, processed carbohydrates and white bread have a high glycaemic index.
Glycaemic Load
Glycaemic load is a measurement of how much a food impacts a person’s blood sugar levels.
Bread Types Compared
| Bread Type | Fibre per 100g | Carbohydrate per 100g | Glycaemic Index | Glycaemic Load | Naturaler Healthiness Rating (1-9 from least to most healthy) |
|---|---|---|---|---|---|
| Multigrain | 7g | 15g | 43-62 | 6-9 | 9 |
| Wholegrain | 9.3g | 15g | 53-75 | 8-12 | 7 |
| Sprouted Bread | 2g | 15g | 55-67 | 8-11 | 6 |
| Sourdough | 2.4 | 15g | 55-70 | 8-10 | 6 |
| Rye Bread | 6g | 15g | 45-70 | 5-10 | 7 |
| Tortilla Bread (White) | 1.8g | 15g | 38 | 6 | 7 |
| Pitta Bread (White) | 2.2g | 15g | 58-69 | 9-10 | 6 |
| White Bread (Fortified) | 2.7g | 15g | 71 | 11 | 4 |
Carbohydrate content, glycaemic index and glycaemic load are calculated using the University of Sydney’s glycaemic database. The values stated are approximated through the comparison of multiple brands from multiple countries.
Glycaemic Index Ranges: 1 to 55 (Low, Score = 3), 56 to 70 (Medium, Score = 2) and 71 to 100 (High, Score = 1).
Glycaemic Load Ranges: 0 to 10 (Low, Score = 3), 11 to 19 (Medium, Score = 2) and 20 and higher (High, Score = 1).
Fibre content is approximated from the US Department of Agriculture’s FoodData Central database except sprouted bread, tortilla bread and wholegrain bread.
Fibre Content Ranges: 0g to 3g (Low, Score = 1), 3g to 7g (Medium, Score = 2) and 7g and higher (High, Score = 3).
The overall Naturaler Healthiness Rating is calculated adding the glycaemic index, glycaemic load and fibre content scores for each bread type. Higher overall scores indicate ‘healthier’ bread. Disclaimer: Naturaler Healthiness Ratings are for reference only and are not a substitute for proper medical or dietary advice.
The Healthiest Bread Types in the UK
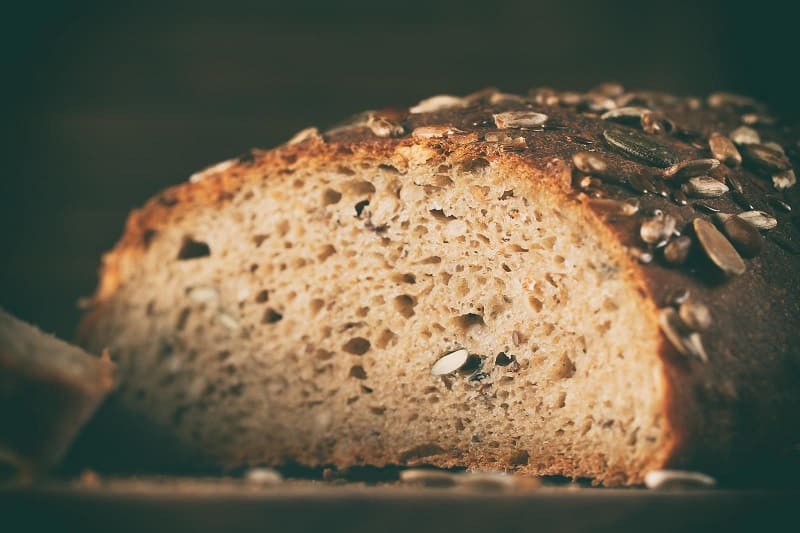
1. Multigrain Bread or Multi-Seed Bread
Naturaler Healthiness Rating
- Fibre Content: 7% (Good)
- Glycaemic Index: 52.5 (Good)
- Glycaemic Load: 7.2 (Good)
- Overall Healthiness Score: 9/9
There is no ‘standard recipe’ for this bread type, and its healthiness varies greatly between different brands. On the whole, breads that contain more varieties of heart-healthy grain will have higher nutrient content and will contain more fibre.
Making a switch from white bread to multigrain bread could significantly increase the amount of fibre in a person’s diet, if eaten regularly.
British supermarkets generally sell multiple types of multigrain bread – these may be marketed with terms such as ‘multi-seed’ and ‘seed bread’.
Multigrain bread receives the highest score possible on our Naturaler Healthiness Rating system: 9/9. It is the only bread we’ve looked at that has both a good glycaemic index, a good glycaemic load and a good amount of fibre.
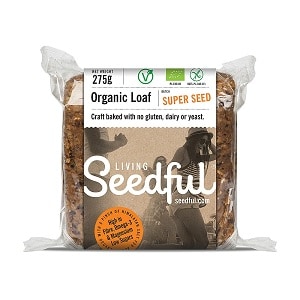
Brimming with heart-healthy seeds and packed with fibre, protein and omega-3 fatty acids, this craft-baked loaf is sure to satisfy.
2. Whole Grain Bread
Naturaler Healthiness Rating – Whole Grain Bread
- Fibre Content: 9.3% (Good)
- Glycaemic Index: 64 (Average)
- Glycaemic Load: 10 (Average)
- Overall Healthiness Score: 7/9
True whole grain loaves are hard to come by, unless visiting an independent baker. Mass-produced, production line whole grain breads are often made with some refined flours. This helps bakers to keep their bread affordable, but decreases its dietary fibre.
Eating wholegrain bread is a great way to increase fibre in your diet. Whole grain breads have the highest fibre percentage of all breads we’ve tested, containing a staggering 9.3% fibre per slice on average.
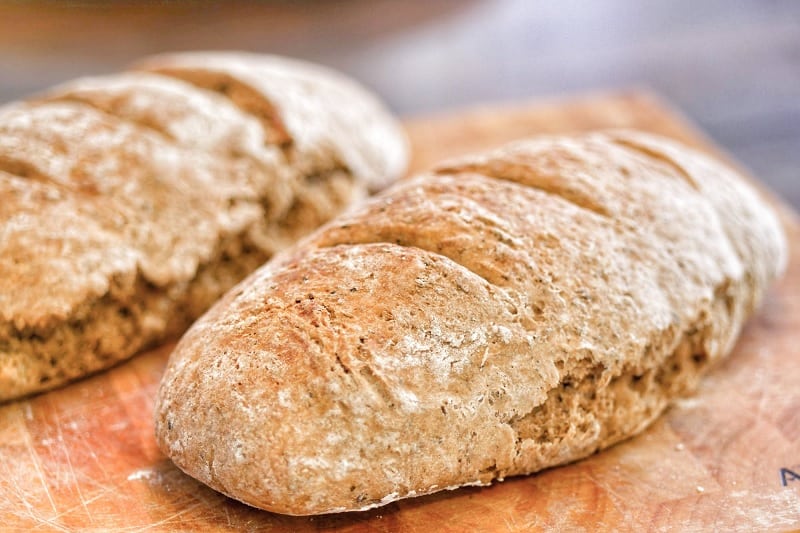
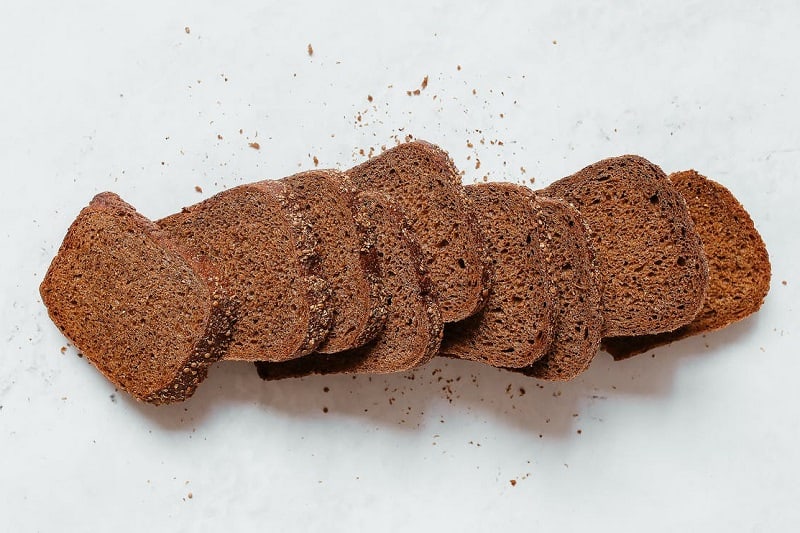
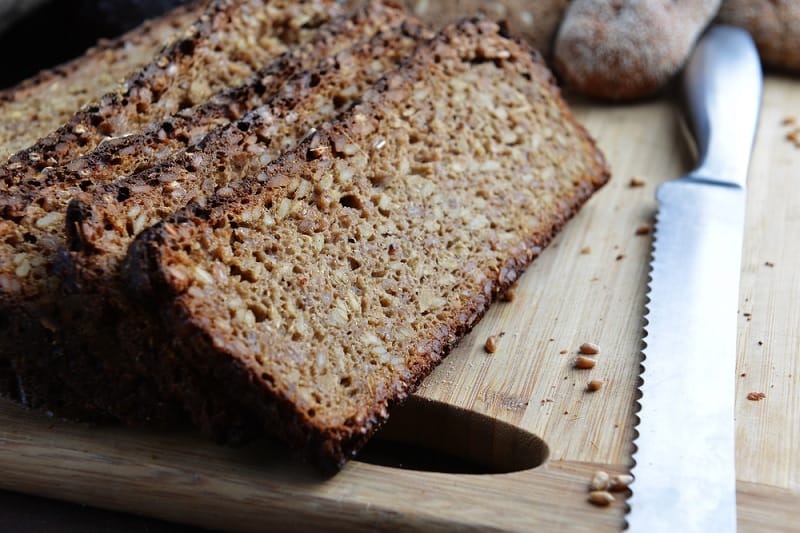
3. Rye Bread
Naturaler Healthiness Rating – Rye Bread
- Fibre Content: 6% (Average)
- Glycaemic Index: 57.5 (Poor)
- Glycaemic Load: 7.5 (Average)
- Overall Healthiness Score: 7/9
Rye bread has been produced since at least the 12th century; it was a staple food of the Middle Ages and remains popular in much of Europe. It’s produced with rye bran (not wheat bran), which produces a dark coloured loaf with a nuttier, more complex flavour.
Rye breads, including Pumpernickel, are rich in B vitamins and essential nutrients including iron, potassium, calcium and zinc. They’re also high in soluble dietary fibre, averaging 6g per 100g of bread.
Rye has the highest (and best) fibre content of all the breads we’ve compared. There’s massive variation between different Rye breads on the market – they’re produced with different quantities and qualities of flour, causing their ‘healthiness’ to vary.
Biona is an authentic German bakery that uses traditional techniques and ingredients.
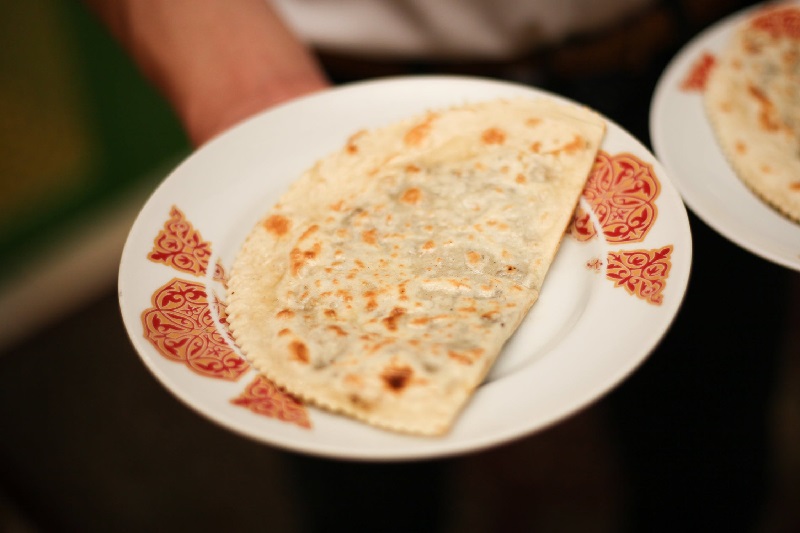
4. Tortilla Bread
Naturaler Healthiness Rating – White (Wheat) Tortilla Bread
- Fibre Content: 1.8% (Poor)
- Glycaemic Index: 38 (Good)
- Glycaemic Load: 6 (Good)
- Overall Healthiness Score: 7/9
Tortillas originated in South America around 10,000 B.C. Traditional tortillas are made with corn flour but most UK supermarkets sell white wheat flour tortillas instead. They are comparatively low in dietary fibre, averaging 1.8g per 100g of tortilla.
5. Sprouted Bread
Naturaler Healthiness Rating – Sprouted Bread
- Fibre Content: 2% (Poor)
- Glycaemic Index: 61 (Average)
- Glycaemic Load: 9.5 (Good)
- Overall Healthiness Score: 6/9
Sprouted bread, which is also sold under the names Ezekiel bread or Essenes bread, is relatively uncommon in the UK.
It’s believed that this ancient bread was first baked by the Essenes Jews in the 2nd century BC. It is produced using flour that has been milled from germinated grains – these are generally wheat grains which have begun to sprout and grow their first small leaves.
By allowing the grains to germinate, their carbohydrate content decreases and their nutritional value increases. Sprouted bread has a slightly sweeter taste than standard white bread.
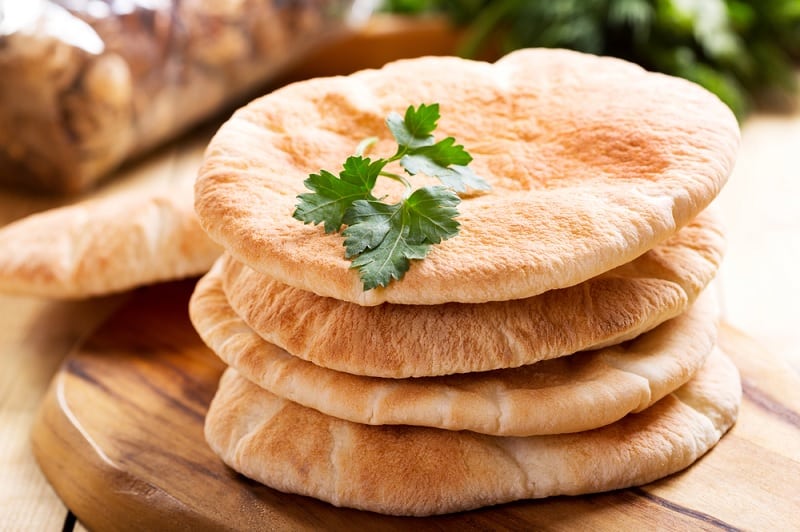
6. Pitta Bread
Naturaler Healthiness Rating – White Pitta Bread
- Fibre Content: 2.2% (Poor)
- Glycaemic Index: 63.5 (Average)
- Glycaemic Load: 9.5 (Good)
- Overall Healthiness Score: 6/9
Pitta bread (spelled ‘pita’ outside of the UK) has been a mainstay of Middle Eastern cuisine for over 4,000 years. It’s generally made with white flour, wholemeal flour or a combination of the two.
Pittas is made with yeast and are folded to inflate during cooking, creating a handy inner ‘pocket’ to hold sweet and savoury fillings.
They contain low amounts of dietary fibre, averaging 2.2g of fibre per 100g of pitta bread.
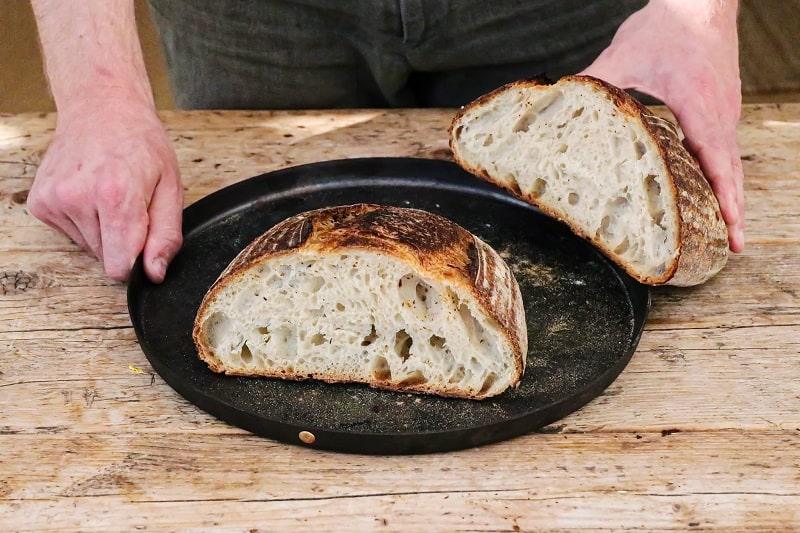
7. Sourdough Bread
Naturaler Healthiness Rating – Sourdough Bread
- Fibre Content: 2.4% (Poor)
- Glycaemic Index: 62.5 (Average)
- Glycaemic Load: 9 (Average)
- Overall Healthiness Score: 4/9
Sourdough bread is ‘naturally leavened’ – it is traditionally made without commercial yeast, although some may be used to speed up the production process and initiate the souring process. It is typically made with white or wholemeal flour.
Sourdough is high in lactic acid – this gives sourdough its signature, slightly-sour taste and extends its shelf life. To create sourdough, dough is encouraged to ferment using lactic acid bacteria and wild yeast before baking.
It’s widely agreed that sourdough bread is healthier than traditional white bread; sourdough has a slightly lower average glycaemic index and is slightly higher in nutrients. However, supermarket-bought sourdough loaves are low in healthy fibre and have a poor glycaemic index.
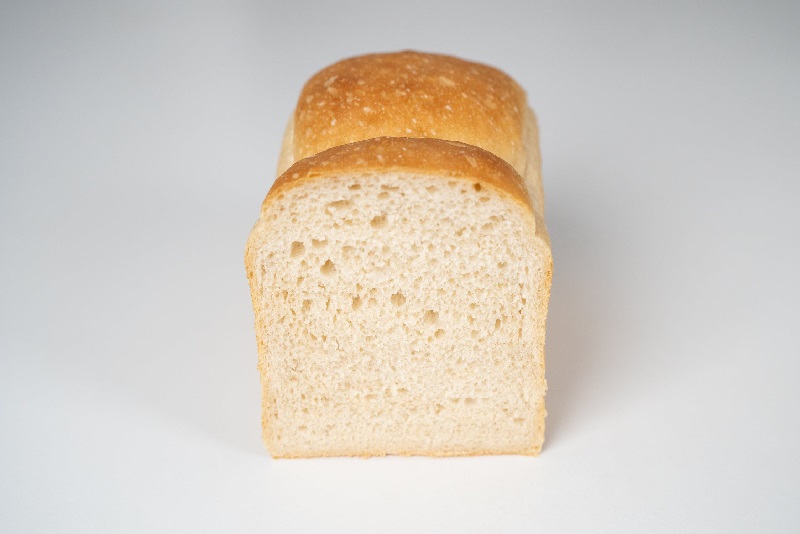
8. White Bread
Naturaler Healthiness Rating – White Bread
- Fibre Content: 2.7% (Poor)
- Glycaemic Index: 71 (Poor)
- Glycaemic Load: 11 (Average)
- Overall Healthiness Score: 4/9
Contrary to common belief, UK flour isn’t bleached to give a whiter appearance. The soft, pale inside of white bread comes from the refinement and processing of wheat into white flour; this removes all of the nutritious bran from the flour, leaving only the starchy carbohydrates behind.
These starchy carbohydrates are naturally lighter in colour, but the refinement process removes much of the dietary fibre, vitamins and minerals from the end product. White bread is approximately 2.7% fibre – this is a relatively poor fibre content.
The glycaemic index of white bread is approximately 71 – this means that consumption is likely to cause blood sugar levels to spike, which can negatively impact long-term cardiovascular health.

Dylan Kitson is a freelance writer and researcher based in Brighton, England. He’s a passionate promoter of all things health, working with supplement companies, health & fitness blogs and consumer review websites.

No mention at all on the spraying of chemicals on the wheat fields and entering the crops then the body. Wheat is pathogenic no matter how these “nutritionists” like to dress it up. Bread is a major contributor to bad health it should not be in your body from Ezekial down to the pap known as white bread. They hung wallpaper with flour and water paste back in history. Forget that Bread is the staff of life its nonsensical conjured up by big bakers to improve sales. Ditch the bread and decongest your body your body will thank you for it. If you cannot ditch bread because of convenience factors eat less and organic. All bread is salty another health hazard. All in all the Staff of life is the stuff of poor health.